
HFA Factbook Online: Data Visualization and Reports User Guide
| Log into HFA Factbook Online
Each year, NCSHA conducts a comprehensive survey of the state housing finance agencies’ program activity and compiles it in the State HFA Factbook. This data includes statistics and trends for key housing programs administered by HFAs, clear evidence of HFA program results and successes, and useful data for analyzing and benchmarking HFA programs and operations. The Factbook Online platform gives users access to the HFA program data online, where they can use the visualization and reporting tools to delve into hundreds of thousands of data points. |
|
Who Can Use the HFA Factbook Online?
HFA and Associate Members: Employees of NCSHA HFA and Associate member agencies have unlimited access to the HFA Factbook Online.
Affiliate Members and Researchers: With each purchase of the current State HFA Factbook, your organization will receive one user license to access the HFA Factbook Online, valid until the next Factbook is published.
How Do I Create an Account?
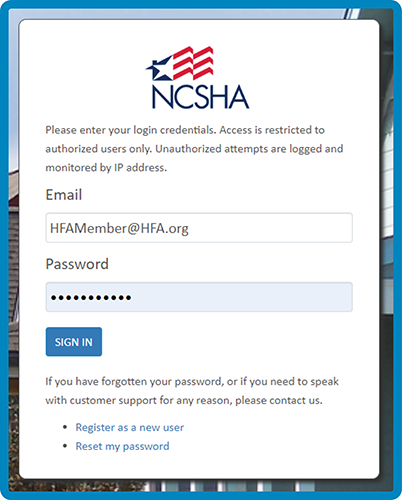
This platform is separate from ncsha.org and requires a username and password.
New User? Please create an account. (The approval process for new users may take up to one business day.)
Registered User? If you have previously submitted data for the Factbook, you are already a registered user. To reset a forgotten password, go to the login panel.
Contact data@ncsha.org for assistance.
What Can I Do with the HFA Factbook Online?
User Guide
- Orientation Resources
- Corrections, Feedback, and Support
- Helpful Links
- Disclaimer/Terms of Use and Online Privacy Policy
- Log In
- Build Your Visualization
- Additional Visualization Functions
- Year-Specific Survey Reports
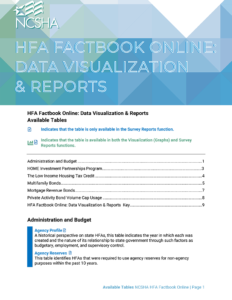
- Available Tables
- “How-To” videos are available 24/7 on the FAQs page.
- To schedule a personal orientation, email Glenn Gallo at data@ncsha.org.
B. Corrections, Feedback, and Support
- Corrections: If you notice errors or missing data, please complete this form or contact NCSHA via data@ncsha.org with comments and questions. While the change will not be reflected in the published Factbook, changes reviewed and approved by NCSHA will be reflected in the Factbook Online.
- Feedback: We are committed to continuously improving this resource. Share your feedback by emailing data@ncsha.org or completing this form.
- Support: Email data@ncsha.org, complete this form, or call 202-624-7710 for assistance.
- FAQs: www.ncsha.org/resource-center/factbook-online-faqs/
- Data Corrections: www.ncsha.org/ncsha-factbook-data-updates/
- Feedback: www.ncsha.org/resource-center/hfa-factbook-online-feedback/
D. Disclaimer/Terms of Use and Online Privacy Policy
- Disclaimer: NCSHA publishes the State HFA Factbook for the general information of its readers. The information contained in the published State HFA Factbook and the Factbook Online is based upon data supplied from a number of sources NCSHA believes to be reliable but cannot guarantee. Hence, NCSHA is not responsible for any errors, omissions, or inaccuracies the data may contain.
- Terms of Use and Online Privacy Policy: All activities on NCSHA online properties are subject to NCSHA’s Terms of Use and Online Privacy Policy.
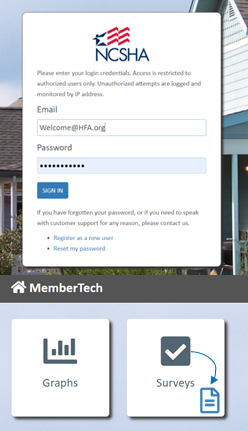
After logging in, two functions are available to you:
- Graphs: Data visualization tool that allows you to filter, view, and compare HFA data compiled between 2005 and 2021.
- Reports: Complete tables by year as published in the Factbook, with footnotes. These may be downloaded as PDFs and Excel documents.
Structure
The State HFA Factbook is divided into the following sections or “Surveys”:
| 1. Administration and Budget 2. HOME Investment Partnership 3. The Low Income Housing Tax Credit |
4. Multifamily Bonds 5. Mortgage Revenue Bonds 6. Private Activity Bonds |
The visualization tool is set up in the same way. Each Survey contains multiple “Categories” or sets of related questions. Each “Name” is a specific survey question and will appear in the name of your graph or table. For example, “Annual Operating Budget” is a name of your graph or table under the “Organization Staffing and Budget” category.
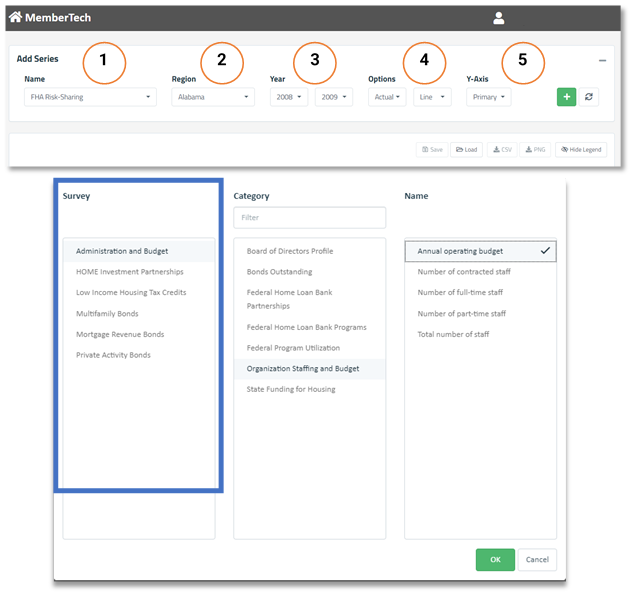
Setting up your visualization is a matter of selecting the desired variables (Name, Region, and Year) and selecting your preferred display.
- After clicking on the dropdown menu Name, a pop-up will display three columns: Survey, Category, and Name
- The Survey column allows you to select the six distinct sections of the Factbook: Administration and Budget, HOME Investment Partnerships, Low Income Housing Tax Credits, Multifamily Bonds, Mortgage Revenue Bonds, and Private Activity Bonds.
- After selecting one of the six Surveys, the second column, Category, will display the available Factbook tables. A full list of Factbook tables with descriptions of the data within each table is available below. Additionally, the search function under Category will identify all tables with the desired key word (e.g., typing “housing credit” into the search filter will display all relevant tables with the term “housing credit” in them).
- The third column, Name, displays all the data fields available within the selected Category. These data fields correspond to the columns found in each Factbook table. It is possible to select multiple data fields to display on the same graph. However, to be displayed on the same axis, all data fields must be measured in the same unit (e.g., people, units, dollars, etc.).
- After selecting the desired Survey, Category, and Name, the next option on the series bar is Region.
- Region displays all available HFAs with data under the previously selected Survey, Category, and Name.
- Multiple HFAs can be selected at the same time. There are also Select All and Deselect All buttons.
- If the Region field is left blank, which is the default setting, all available HFAs will be automatically selected.
- After choosing which HFAs to select, the next option is to choose which years to examine.
- For most Factbook tables, the From dropdown will begin at 2005. For Factbook tables introduced after 2005, the From dropdown will begin at the year in which the data was first collected. The To dropdown menu will allow you to select the range of time in which the data will display. The To dropdown menu will always end with the latest year of available data.
- It is possible to display only one year of data. To do so, select the same year in both the From and To menus.
- If both the From and To dropdown menus are left blank, which is the default setting, the chart will automatically display over the longest available range.
- The Options dropdown menu determines how the selected data will be displayed.
- In the first dropdown menu, there are five different selections: Actual, Sum, Average, Maximum, and Minimum. Actual will display each of the selected HFAs separately.
- The second dropdown menu determines whether the selected data will be displayed as a line chart or a bar chart. It is possible to use both options in the same chart.
- The Y-Axis dropdown menu determines on which side of the chart the Y-Axis displays. Selecting Primary will cause the Y-Axis to be displayed on the right-hand side, while selecting Secondary will cause the Y-Axis to be displayed on the left-hand side.
- This function allows the display of two different units of measurement on the same chart. For example, a data field displaying units can be selected as the Primary Y-Axis, while a different data field displaying $ can be selected as the Secondary Y-Axis.
Step 7: Add a Series (Additional Data)/Clear Chart (Start Over)
- To the right of the Y-Axis dropdown menu are two buttons. The first button, a green addition sign, populates the data previously selected into the chart. The second button, two lines forming a circle, clears the chart.
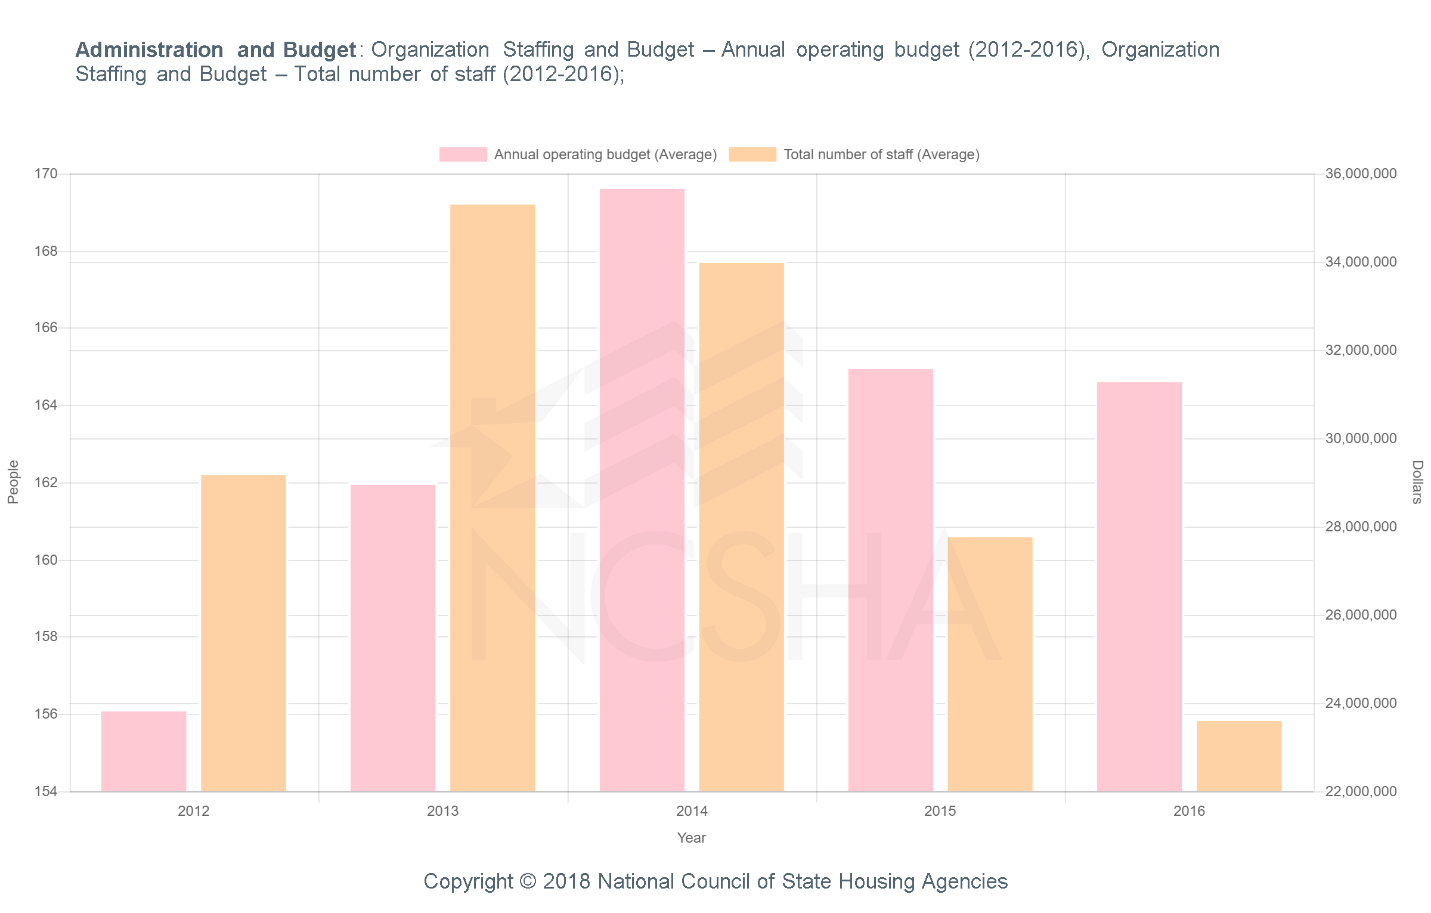
Sample PNG
G. Additional Visualization Functions
There are five additional buttons below the dropdown menus described above: Save, Load, CSV, PNG, and Hide Legend/Show Legend
![]()
- The Save button allows you to name and save a chart for later access.
- The Load button recalls a previously saved chart.
- The CSV button downloads the underlying data used to create the chart as a Microsoft CSV file.
- The PNG button creates a PNG file of the displayed chart.
- The Hide Legend/Show Legend button temporarily removes the legend, enlarging the chart size. Clicking the button again recalls the legend.
H. Year-Specific Survey Reports
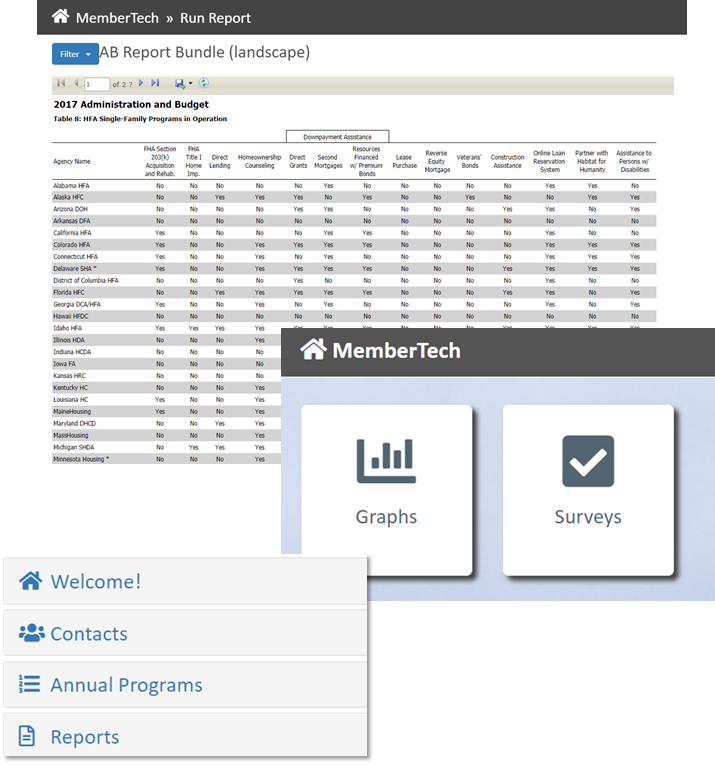
Benefits of the visualization tool include the ability to see data across years and mix data from multiple tables. If you would like to see the data in a year-specific table or reference the footnotes, which are not available in the visualization tool, you have two options.
First, you can reference the PDF, which can be requested from data@ncsha.org. Second, you can access the Reports function under the Surveys tab. (Please see the image to the right or the video below.) After selecting Reports, click on a specific report, and set the Report Criteria for any year between 2005 and 2021.
Individual tables can be saved as Excel documents or PDFs.